Starting Point
How hot each neighbourhood gets
A heat hour is one hour where average outdoor air temperature is above 35 C. The chart shows the hotter future if no neighbourhood changes are made.
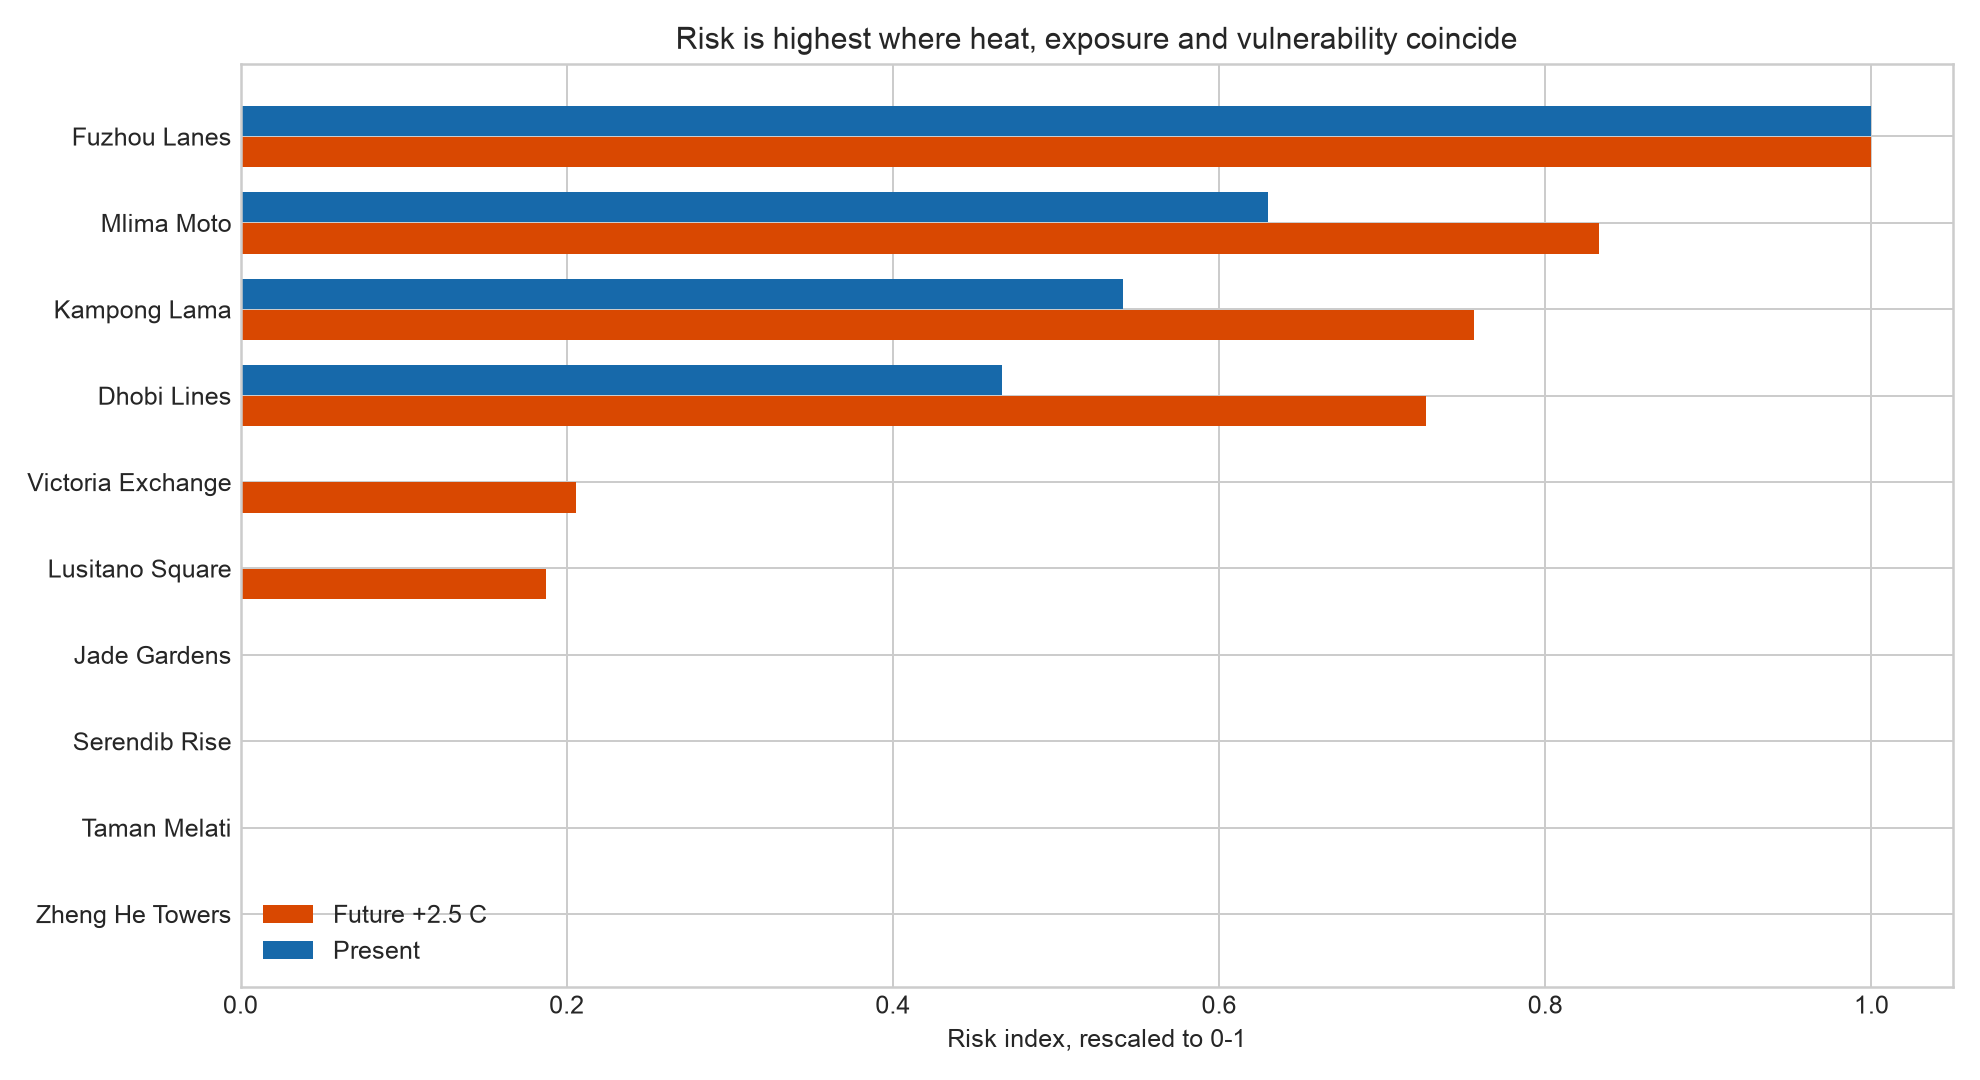
How Risk Is Scored
The risk score combines heat, people and sensitivity
How often a neighbourhood crosses 35 C in the future weather run.
How many people are likely to be in the neighbourhood during the day.
Whether people have less protection, such as low AC access, outdoor work, deprivation, or age-related vulnerability.
The final risk score is high only when all three are high. A very hot but mostly empty neighbourhood, or a crowded but cooler one, scores lower.
Tested Options
Which changes helped?
Negative changes are good: they mean fewer heat hours. Positive changes mean the option made heat hours worse. For the reflective-surface tests, paving and buildings started at 0.20 and were tested at 0.35.
| Option Tested | Group | What changed | Before | After | Average change | Best to worst sites |
|---|
Neighbourhood Detail
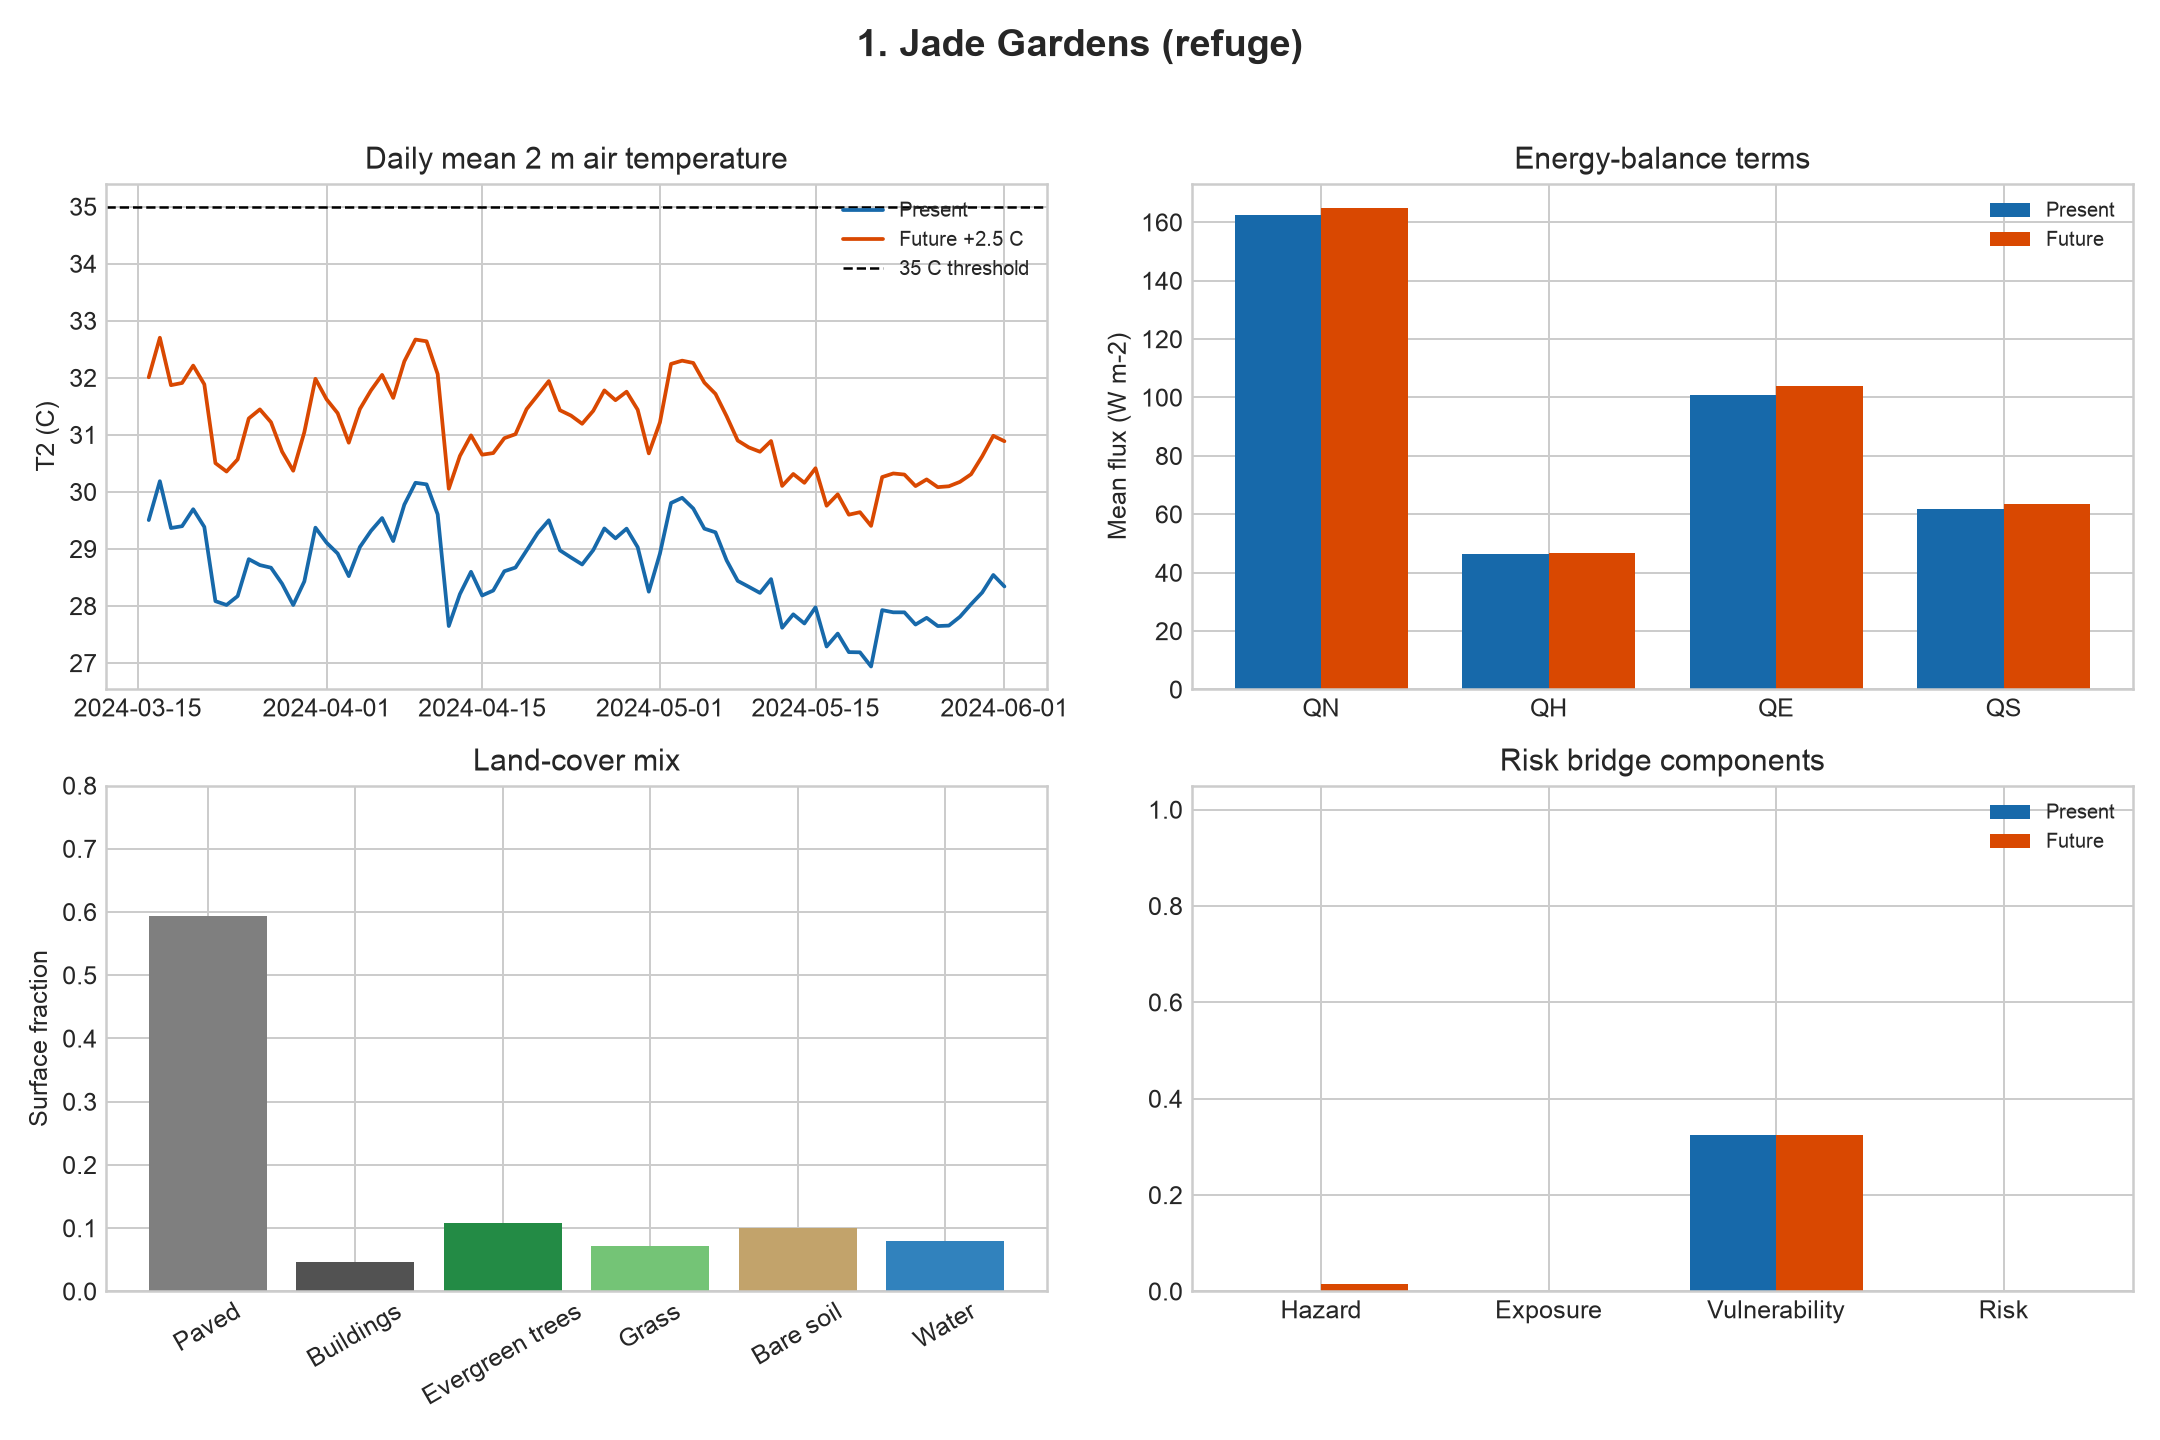
Choose a neighbourhood
-
-
-
- Current heat hours
- -
- Future heat hours
- -
- Average future temperature
- -
- Heat into air / evaporation
- -
| Option Tested | Before | After | Heat-hour change | Risk-score change |
|---|
Interpretation
What this means for decisions
Cooler paving helped most
Making paved surfaces more reflective reduced heat hours in every neighbourhood we tested.
Trees need a fuller test
The tree-only surface change increased this air-temperature metric. That does not mean trees are bad; it means we did not yet model shade and water support well enough.
Water-only changes were small
Adding a little water helped slightly. Changing irrigation or soil storage alone did not change the heat-hour count.